

.
Adobe Illustrator is a vector graphics editor and design program that is popularly used to create beautiful designs that can go anywhere—print, web and apps, video and animations, and more. In this training, you will be using AI to create infographics and InDesign to lay them all out.
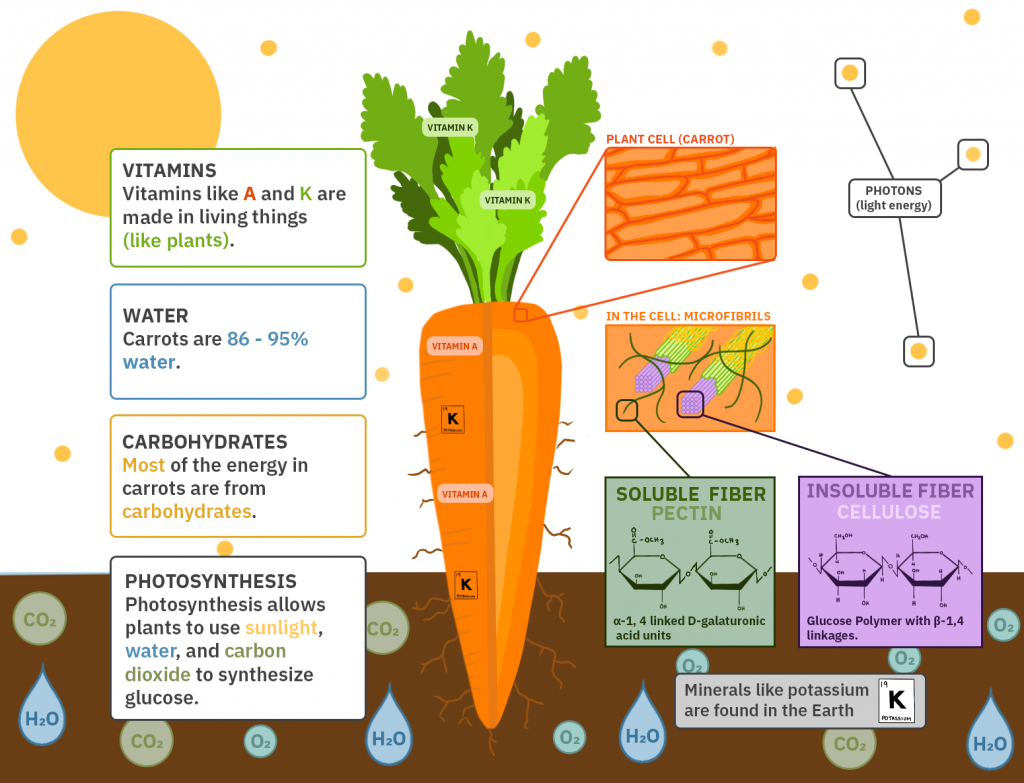
An infographic is any graphic that helps people understand a topic. As a rule, it should be easier to digest than the same information in writing. Infographics use striking, engaging visuals to communicate information quickly and clearly; they can be anything from simple vector graphics to a graph to smart typography!

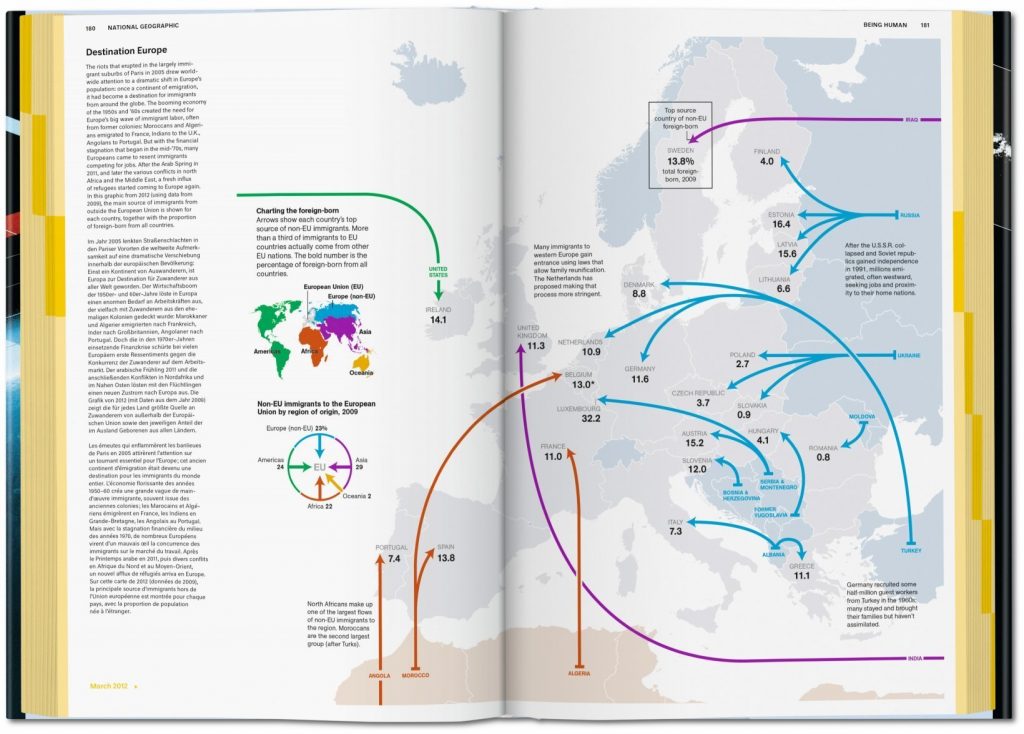
Think of yourself for this KB training as a graphic designer for National Geographic or a comparable establishment. Have that aesthetic for info-graphic in mind. Here are some examples to spark inspiration.

Your main goal for this training will be to make an engaging infographic spread that makes a complicated topic easier to digest. Below, we will guide you through creating different types of graphs and vector drawings in Illustrator. Use these pointers to create an infographic for one of the following articles. Let an STA know if you have if anything in the articles doesn’t make sense.
Once you pick your topic, pick one section or paragraph to make your infographic. Post to BC when done.
https://www.texastribune.org/2020/10/07/texas-house-fundraising/
Creating Infographics
- Making Graphs in Illustrator
Before we start creating multiple infographics and laying them out, we need to learn how to make basic graphs. Illustrator allows you to create bar graphs, pie charts, and line graphs with a special tool, but it comes out ugly, so we’ll have to stylize them.
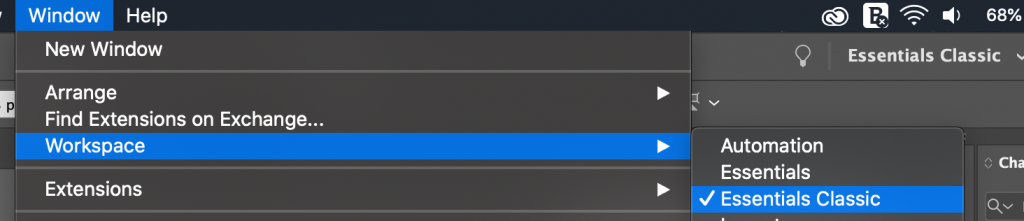
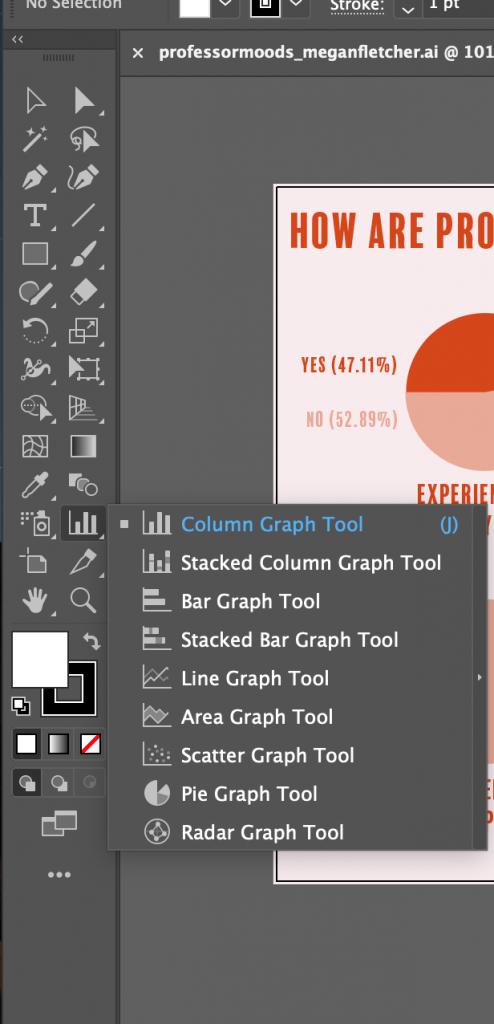
Pie Chart The graph tool isn’t on your Illustrator toolbar by default, so you’ll need to change your workspace. Go to Window >> Workspaces >> Essentials Classic to have the graph tool available.
To make a pie chart, right-click on the graph tool and click the pie chart icon.
Click, drag, and release to make the basic pie chart. It’ll have a popup where you’ll put the data. Put in your data. It doesn’t have to be in percentages. Illustrator will do that math for you.
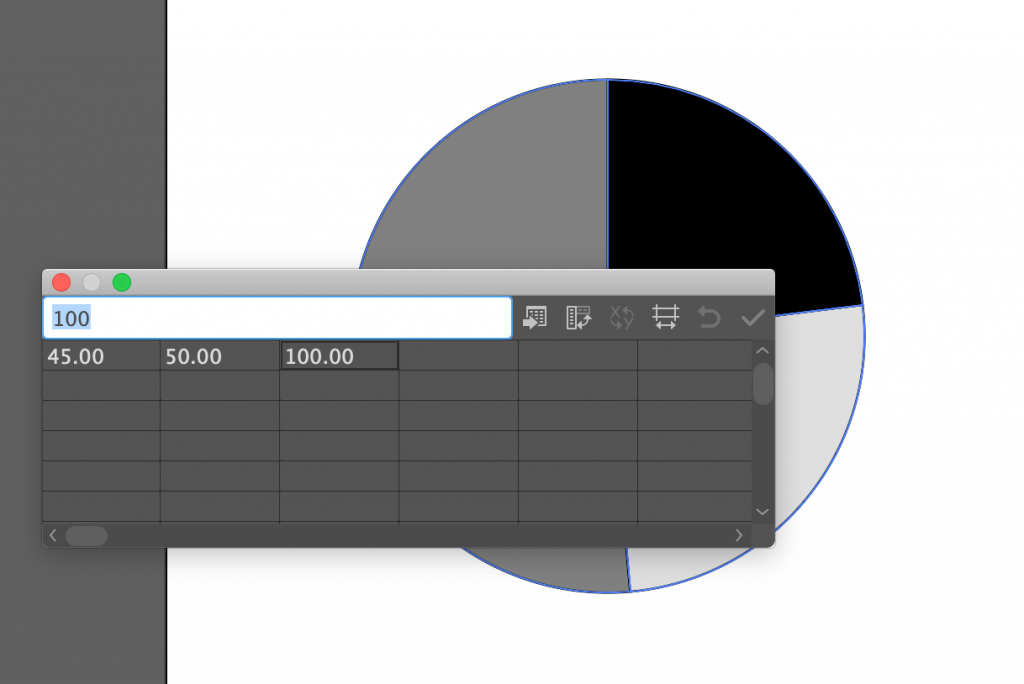
Now, the pie chart is black and white with a stroke. To stylize it, we’ll have to ungroup the elements, but do that, we have to relinquish our data editing privileges. Once you’re confident your data is correct, select the pie chart and use Object >> Ungroup or SHIFT + COMMAND + G to ungroup the pie slices. Hit yes on the popup.
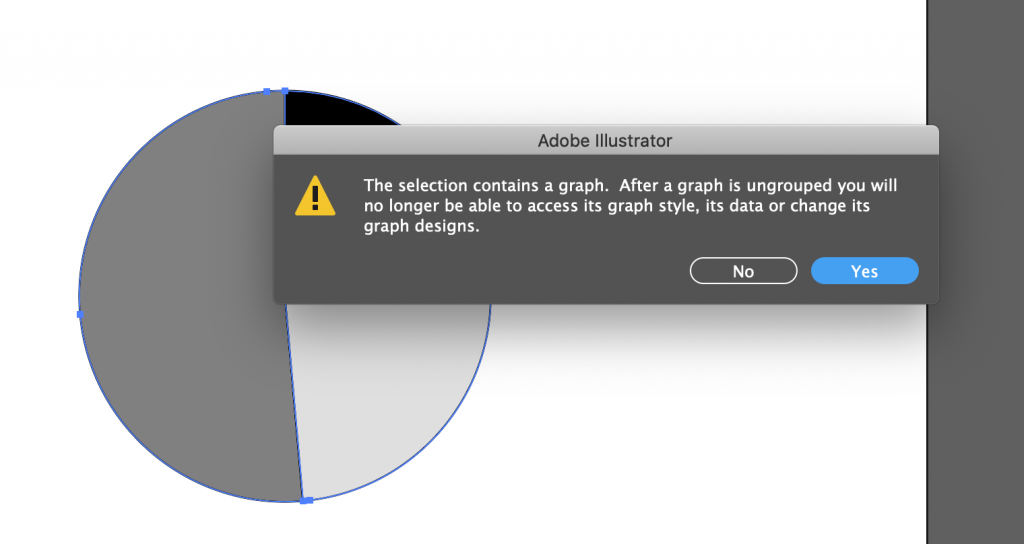
Then, click on the slices and give it the color and stroke you want. Make sure they don’t clash. Decide how you want the chart as a whole to look. You can separate the slices, put a white circle in the middle to make a donut chart, or leave the chart the way it is.
Below is an example of an pie chart graphic created in Illustrator.

Bar Chart
Bar charts are super similar to pie charts in Illustrator. Make sure you’re in the Essentials Classic workspace before right clicking on the graph tool and picking a bar chart option.
Click, drag, and release to make the basic bar chart. It’ll have a popup where you’ll put the data. Put in your data. If you want a double bar graph, arrange the numbers for each bar group on top of each other.
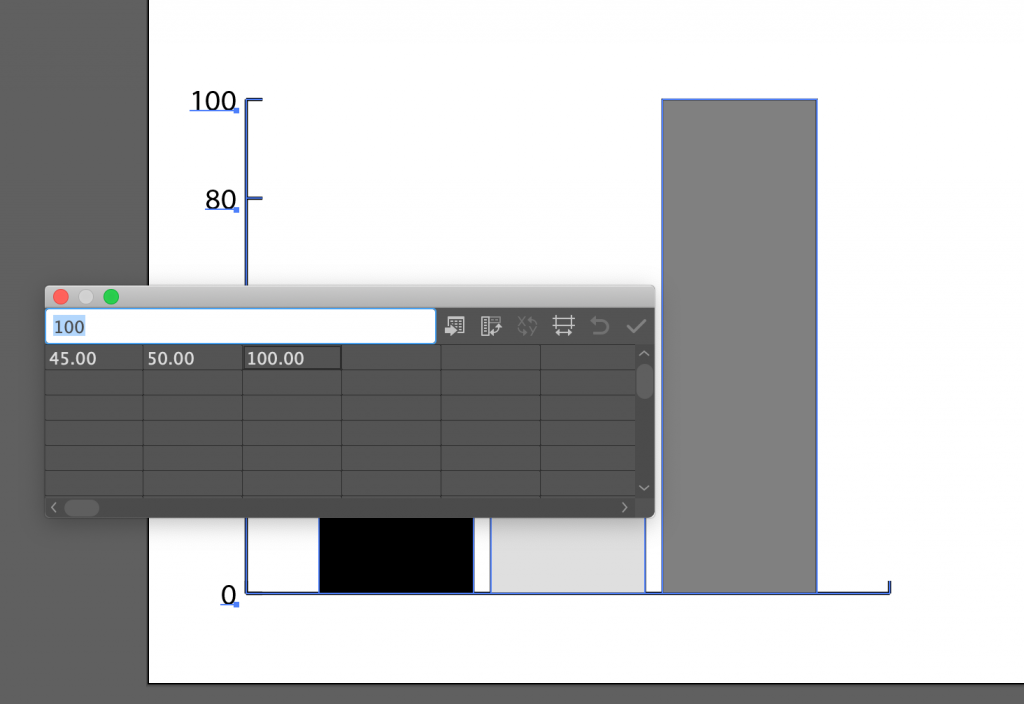
Now, the bar chart is black and white with a stroke. To stylize it, we’ll have to ungroup the elements, but do that, we have to relinquish our data editing privileges. Once you’re confident your data is correct, select the pie chart and use SHIFT + COMMAND/CTRL + G to ungroup. Hit yes on the popup.
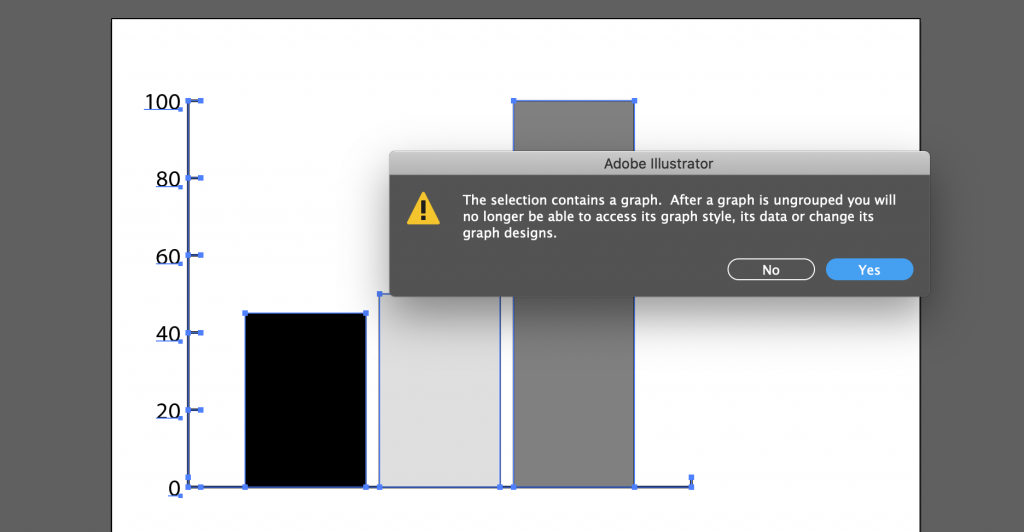
Click on the bars and give it the color and stroke you want. Make sure they don’t clash. Then, click on the numbers on the vertical axis. You can change the font and font size of them as a group.

Using the text tool, add axis labels, bar labels, and a title to your graph.
2. Making vector graphics in Illustrator using the pen & curvature tool
Vector graphics are works made from points, lines, and curves that are based upon mathematical equations, rather than solid colored square pixels. Vectors are often used in infographics because no matter how large or small or how close you zoom in on the image, the lines, curves, and points remain smooth!
You have already learned to create vector graphics in Illustrator through previous KB training (tracing images and manipulating shapes). However, another way to create vectors is by using the pen and curvature tool to create shapes.
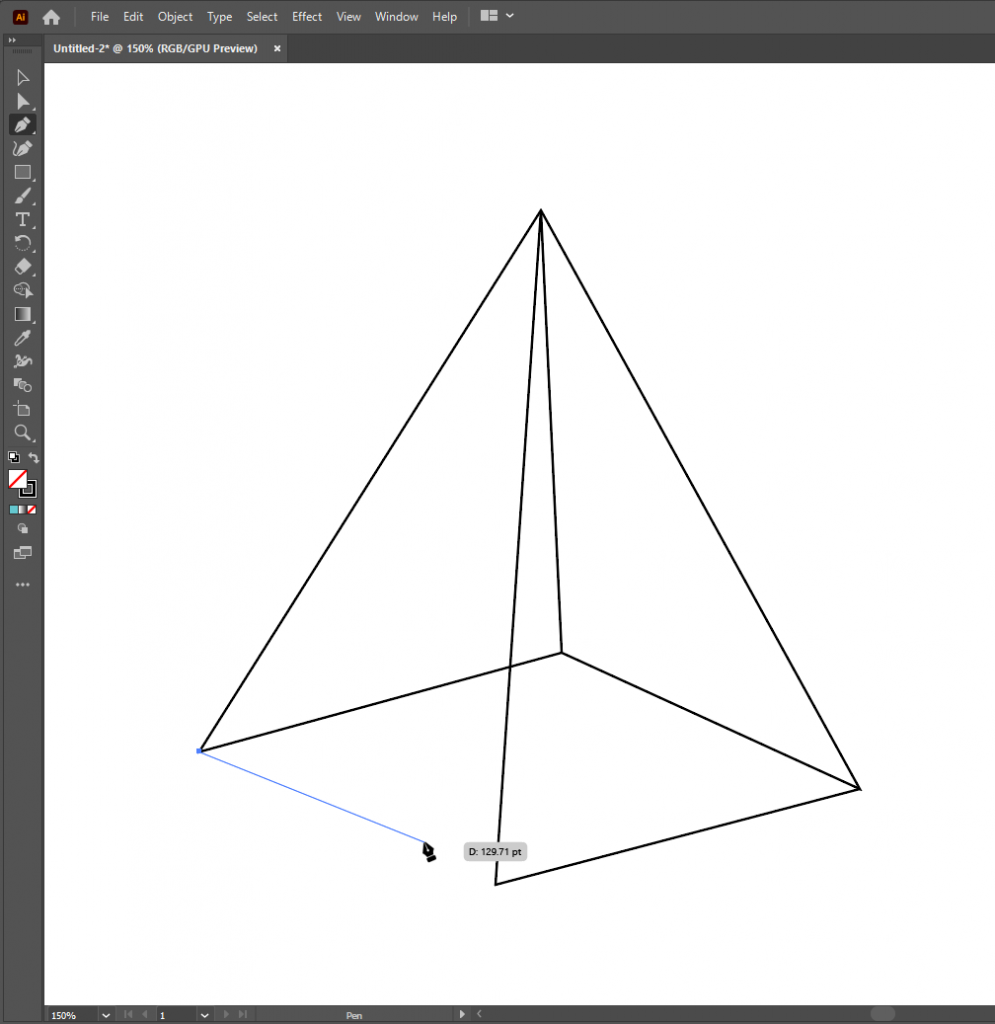
The Pen Tool
⇒ the pen tool can be used to create straight segments
- Select the Pen tool
- Position the Pen tool where you want the straight segment to begin, and click to define the first anchor point (do not drag)
- Click again where you want the segment to end (Shift-click to set the angle of the segment to a multiple of 45°)
- Continue clicking to set anchor points for additional straight segments.
- Complete the path by doing one of the following:
- To close the path, position the Pen tool over the first (hollow) anchor point. A small circle appears next to the Pen tool pointer when it is positioned correctly. Click or drag to close the path.
- To leave the path open, Ctrl-click (Windows) or Command-click (macOS) anywhere away from all objects.
- To leave the path open, you can also select a different tool, or choose Select > Deselect. You can also simply press Enter or Return to leave the path open.
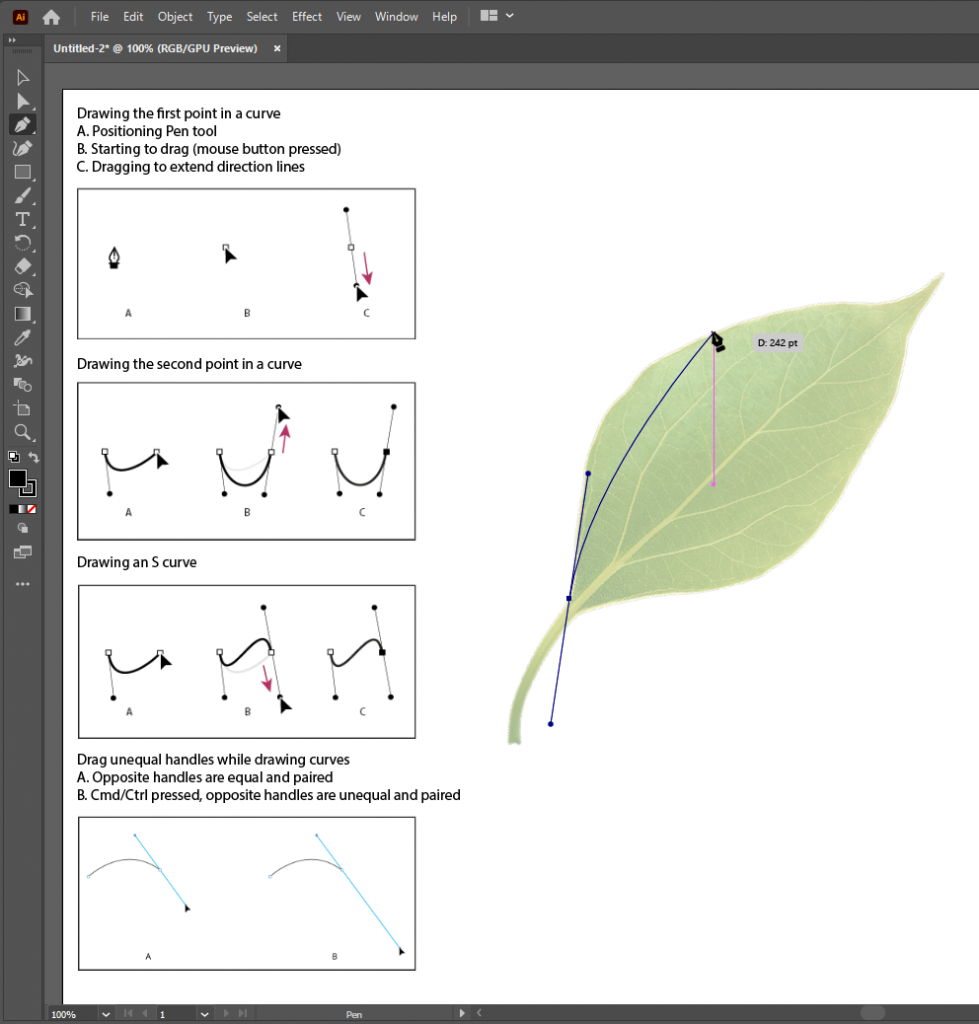
⇒ you can also create curved lines using the pen tool by adding anchor points
- Select the Pen tool.
- Position the Pen tool where you want the curve to begin, and hold down the mouse button. The first anchor point appears, and the Pen tool pointer changes to an arrowhead.
- Drag to set the slope of the curve segment you’re creating, and then release the mouse button.
- You can adjust one or both sides of the direction line later by using the direct selection tool to move anchor points.
- Hold down the Shift key to constrain the tool to multiples of 45°
- Position the Pen tool where you want the curve segment to end, and do one of the following:
- To create a C‑shaped curve, drag in a direction opposite to the previous direction line. Then release the mouse button.
- To create an S‑shaped curve, drag in the same direction as the previous direction line. Then release the mouse button.
- Continue dragging the Pen tool from different locations to create a series of smooth curves. Note that you are placing anchor points at the beginning and end of each curve, not at the tip of the curve.
- Complete the path by doing one of the following:
- To close the path, position the Pen tool over the first (hollow) anchor point. A small circle appears next to the Pen tool pointer when it is positioned correctly. Click or drag to close the path.
- To leave the path open, Ctrl-click (Windows) or Command-click (macOS) anywhere away from all objects.
- To leave the path open, you can also select a different tool, or choose Select > Deselect.
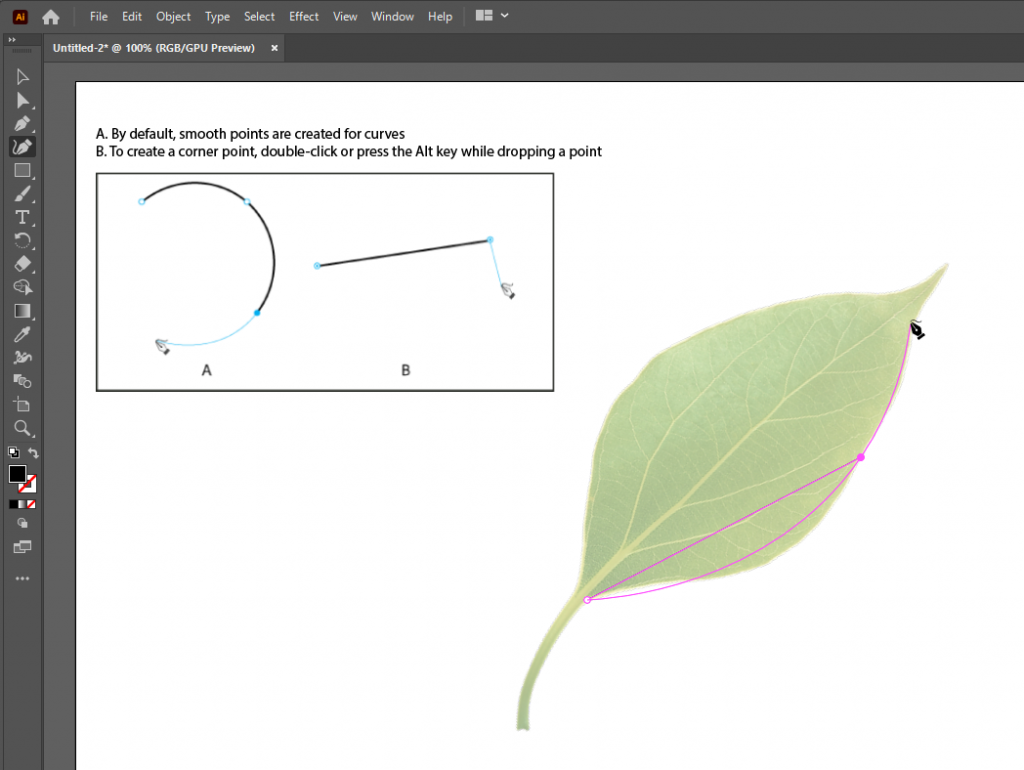
The Curvature Tool
⇒ this tool enables you to create, toggle, edit, add, or remove smooth or corner points. You don’t have to switch between different tools to work quickly and precisely with paths
- Select the Curvature tool ().
- Drop two points on the artboard, and then view the rubber band preview display the shape of the resulting path depending on where you hover your mouse.
- Use the mouse to drop a point or tap to create a smooth point. To create a corner point, double-click or press the Alt key while clicking or tapping.
When using the curvature tool, you can perform several actions:
- Option (macOS) / Alt (Windows) + click to continue adding points to an existing path or shape.
- Double-click or double-tap a point to toggle the point between smooth or corner points.
- Click a point or tap it and then drag the point to move it.
- Click or tap a point and press Delete to delete the point. The curve is maintained.
- Press the Esc key to stop drawing.
Creating Drawings From Vector Lines and Shapes
Using the pen and curvature tool, you can create a variety of shapes to make unique scalable, vector drawings. Here are some examples of vector drawing infographics created by fellow LAITS designers!
Part II: Putting it All Together
Overarching concepts, laying out the infographics, typography
Not all infographics are graphs. They can be maps, charts, vector graphics, lines, and a whole lot more. Take a look at the examples in this Box folder to get an idea of the possibilities.
>> https://visme.co/blog/types-of-infographics/
For this training, you will be making an individual infographic about a particular topic. The infographic that you create should be able to stand alone from the writing, and effectively deliver the message of the section of the article that you have chosen.
Ask yourself these questions:
- What’s the most important information here?
- Do my infographics simplify the info or make it more complicated?
- What would be the first thing one’s eye is drawn to?
Pitch a few infographic ideas before you get started. What kinds of charts do you think would work best with the article you chose?
Note: If you would like to practice setting up your infographic to go to print, follow our tutorial on how to Add Bleed and Crop Marks to a PDF. Use one of the standard print sizes for magazines and posters.