State-Building and Property Regimes in Africa: A Talk with Catherine Boone of the UT Department of Government

Professor Catherine Boone of the Department of Government at UT-Austin spoke to an audience of graduate students and professors from Sociology, Government and other disciplines recently about her latest research on territorial politics and rural property regimes in contemporary Africa.  The talk, which took place on Friday, October 21st 2011, was the latest event organized by Power, History, and Society (PHS), a faculty-student network at UT, founded by graduate students and faculty in the Department of Sociology and  led by Professor Maya Charrad.  Sociology graduate student Christine Wheatley served as discussant, responding briefly to Professor Boone’s talk and setting the stage for the Q & A that followed. Other graduate student members of the PHS network assisted in organizing the talk, including Nicolette Manglos, Nicholas Reith, and Julie Beicken.

Professor Boone began her talk by giving a brief overview of the history of political science and political sociology scholarship on Africa.  Since structuralism’s apex in the 1970s and 1980s its influence within research on politics has declined.  This, coupled with the complexities of African societies, led many to conclude that there was little “structure” to be found on the African continent characterized by fictive “free peasants.”  In this context, where over 70 percentof Sub-Saharan Africans still live in rural areas, our scholarly understanding of rural social structures and agrarian-state relations is still woefully incomplete.  Those most aware of the complexities and intricacies of African societies have been anthropologists, who are often anathema to structuralist approaches.   Others have continued to spin behaviorist, voluntarist, culturalist and neo-patrimonial theories of African politics.

Thus, in her latest book project, Professor Boone attempts to make a structuralist and institutionalist argument about the ways that certain land tenure regimes, which govern access to land and vary across national and sub-national spaces, can have stark political effects on the scale and scope of political conflicts.  She proposes a typology of land tenure regimes that consists of three distinctive forms: familial land holding, local and regional chieftaincies, and statist regimes, where direct agents of the central state control land allocation.  These variations in land tenure regimes, she argues, produce two important and related political effects. First, they influence the scale and scope of redistributive conflicts around land. For example, if land allocation is controlled by family/lineage, then disenfranchised persons must limit their grievances to the family.  Second, they produce geographic unevenness in local possibilities for national citizenship, political voice in the national arena, and liberal democratic representation at the national level. Thus, if conflicts are limited in scale and scope beneath the national level, so is political participation of citizens involved in the conflict at the national level.

This comparative and structuralist argument is timely and has broad implications beyond explaining current political conflicts in Africa.  In the context of globalization and the neo-liberal pressure for the state to retreat from arenas it once controlled, it sheds light on the various effects of decentralization, helping us to compare and contrast its political, social, and economic costs and benefits.  It also shows how less centralized rural property regimes– whether at the level of extended family/lineage or chieftaincies, while problematic in several ways, seem to serve as the last line of defense against the looming threat of land dispossession by the global market.  As land values rise and there is increased pressure from international buyers, a centralized state system of land tenure may make the market so “efficient” as to make it even easier to drive current inhabitants off of the land that they have long occupied.  It also broadens the potential for wider, national level conflicts.

Sociology Professors Alex Weinreb and Nestor Rodriguez as well as a number of graduate students from the Departments of Sociology and Government and other departments engaged Boone in a spirited discussion and debate inspired by her research.  The discussion revolved around comparative methodology, as well as the question of critical historical antecedents, in particular, the question of how far back in history it is necessary to engage in order to make an argument of structural causation.  Other lucid comments focused on comparisons between pre-capitalist Europe and Africa, which clearly differ in numerous ways, yet lend themselves to structuralist arguments of different types because of similar historical processes of land enclosure and dispossession.

Both the Power, History and Society Network and the Department of Sociology would like to thank Professor Boone for her excellent and engaging talk.  And we look forward to future cross-departmental exchanges and PHS events with others.

A Sociologist visits Occupy Wallstreet

Jonathan Wynn is an urban/cultural sociologist and blogger whose book The Tour Guide, Walking and Talking New York was recently published by the University of Chicago Press.

From the Everyday Sociology Blog:
A Sociologist Visits Occupy Wallstreet

Perhaps we will invite Dr. Wynn to stop by during SXSW, included in his research examining how city stakeholders have adopted “festivalization” as an urban cultural policy, and the affects of city branding on both locals and visitors, event organizers and participants.

“Epidemiography”… Say What?

Sociologists have long been familiar with metaphors, analogies, and theories imported to the social realm from the natural sciences. One of our founders Durkheim viewed society as a living “social organism.”

Fast forward to 2011 where the proliferation of new communications technologies such as Twitter have once again spawned (pardon my biological lingo) new comparisons with the biological realm.

In his recent blog post, Anthropologist John Postill expounds upon some of the basic ideas of his new book Democracy in the age of viral reality: a media epidemiography of Spain’s indignados movement, which we may find applicable to the socially networked social movements/protests/revolts/revolutions happening around the world.

Many of us have already become familiar with the term “viral” when referring to the way comic and political videos quickly become popular on youtube. But Postill applies this analogy to social protests, believing that social media have been a game changer that created a “new media ecology” that foments “outbreaks” of this virus of opposition that regimes in the Arab world and even governments in the developed world have found difficult to “quarantine.”

Contrast this media ecology view with the more material perspective of the Latin American intellectual and journalist Raúl Zibechi who was quoted here as saying:

I don’t believe in virtual spaces, spaces are always material as well as symbolic. It’s another matter to speak of virtual media of communication among people in movement….

This raises the question of the material cost of protest and whether online social media actually constitute a “space” for protest, or rather are simply the latest tool in a long line of printing presses, telegraph machines, telephones, radios, fax machines, cassette tapes, satellite television, and other media used to spread messages of dissent and mobilize protesters and revolutionaries.

Ithiel de Sola Pool seemed to lean more toward the latter in his famous book, Technologies of Freedom.

Is becoming a facebook fan of a protest page anything other than simply a convenient barometer for public sentiment? Is it a viral outbreak of resistance that must be “quarantined”, or is armchair revolution simply not revolution?

In the Egyptian protests last January, Mohammed Bamyeh notes here that some of the most critical moments that led to the downfall of Hosni Mubarak came during the period when the government had actually shut down all internet in the country, and protesters used more traditional means to organize and still were able to have millions protesting around the country.

Contrast this with the “viral” Occupy Wall Street movement, which uses the slogan “We are the 99%”, but is only able to get a thousand or so at a time to show up, even with the full force of social media, the organization of volunteers providing food, and the attraction of performers coming to put on concerts for the protesters.

In the end of the day, is the difference between Tahrir Square and Zucotti Park, even after more than 40 years of authoritarian rule in Egypt, more about family, neighborhood and community than it is about technology? Is it possible to organize a mass social movement in a society that is “bowling alone”?

STATA Geek Out – Tables with outreg2

Aside from the very interesting theoretical and political-sociology oriented posts of late, some of us at the UT Austin Soc blog would also like to encourage other types of posts with a more methodological angle.

Since many of us use STATA for statistical work, I thought a series of posts on STATA tips and tricks would be a good place to start our “geek out” and share some time-saving, or just plain cool commands.

So here I’m going to give a little bit of sample code for getting tables and graphs out of STATA for a more manageable look at results.

TABLES

When it comes to tables, there are a number of useful programs built in to STATA to export results of regressions and other data. STATA 12 now comes with an improved menu button for exporting certain parts of the raw data to excel. “Tabout” is a useful tool for creating summary excel tables of tabbed data, for example average income by gender, if the data is from a certain country.

But many times it is not simple data or tabs that we want to see in excel, but rather more complex results of our regressions. Our eyes can only take so much of staring at the output window and it is hard to make connections without seeing things in neat tables. Sometimes we even need to create publication quality tables to insert into articles.

Now, copying and pasting and formatting by hand is always an option. But over the course of just one project, not to mention an entire PhD program, the countless hours spent making revisions by hand until perfection seem to justify the short-term time-expenditure on learning how to automate tables in your STATA code.

For this purpose then, there are two excellent little programs called “estout” and “outreg”. “estout” enables you to output a specific set of regression (or other analysis) results after first saving them with “esttab.” “outreg” is a bit more automated, and in fact my favorite, which I will demonstrate here is “outreg2”, which has more bells and whistles and seems to work well even with more advanced models beyond simple regression.

For this purpose, I will use a simple country level data set collected from the World Bank website, which includes three variables: 1) country, 2) hiv (average hiv infection rate for the past 5 years), and 3) pov (average poverty rate for the past five years).

DISCLAIMER: I came across the question of whether poverty has a significant effect on HIV infection rates in some development literature, much of which assumes that the two are linked. However, the jury is still out and this simple regression exercise does not in any way claim to offer answers. Rather it aims only to demonstrate some techniques for data analysis in STATA. Statistics probably can tell us something about this question, but for that, a much more complicated model would be appropriate.

So, there are several steps to get our neat excel output. (In case you are totally new to STATA, note that the actual code you type comes on the lines below that begin with periods, and what follows is the output.)

First, we run our basic regression:

. reg hiv pov

      Source |       SS       df       MS              Number of obs =      61
-------------+------------------------------           F(  1,    59) =    0.76
       Model |  19.0177362     1  19.0177362           Prob > F      =  0.3873
    Residual |  1478.91636    59  25.0663791           R-squared     =  0.0127
-------------+------------------------------           Adj R-squared = -0.0040
       Total |   1497.9341    60  24.9655684           Root MSE      =  5.0066

------------------------------------------------------------------------------
         hiv |      Coef.   Std. Err.      t    P>|t|     [95% Conf. Interval]
-------------+----------------------------------------------------------------
         pov |  -.0190502   .0218708    -0.87   0.387    -.0628136    .0247133
       _cons |     3.1443    .970026     3.24   0.002     1.203282    5.085317
------------------------------------------------------------------------------

Next, we can call up a list of the estimates obtained from the above regression.

. ereturn list

scalars:
                  e(N) =  61
               e(df_m) =  1
               e(df_r) =  59
                  e(F) =  .7586949891917172
                 e(r2) =  .0126959765324349
               e(rmse) =  5.006633506264527
                e(mss) =  19.01773619459277
                e(rss) =  1478.916364896987
               e(r2_a) =  -.0040379899670153
                 e(ll) =  -183.795077505511
               e(ll_0) =  -184.1847839095903
               e(rank) =  2

macros:
            e(cmdline) : "regress hiv pov"
              e(title) : "Linear regression"
          e(marginsok) : "XB default"
                e(vce) : "ols"
             e(depvar) : "hiv"
                e(cmd) : "regress"
         e(properties) : "b V"
            e(predict) : "regres_p"
              e(model) : "ols"
          e(estat_cmd) : "regress_estat"

matrices:
                  e(b) :  1 x 2
                  e(V) :  2 x 2

functions:
             e(sample)

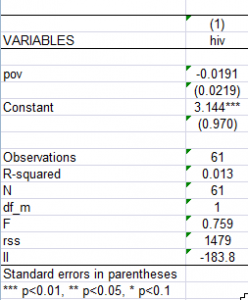
With these estimates we can use outreg2 to create a simple table.

. outreg2 using OUTPUT_hiv_pov_countries, e(N df_m F rss ll) excel replace
OUTPUT_hiv_pov_countries.xml
dir : seeout

So, it’s as simple as that. Just run your analysis, call up the list of estimates, and plug those in to have outreg2 create a nice excel table like the one below. As you can see, one cool feature of outreg2 is that it automatically adds 1, 2 or 3 stars to your estimates in order to indicate whether they are statistically significant at the .1, .05, or .01 levels. This is not only a publication convention, but is also very useful for a quick eyeball look at your results, to see if you are on the right track.

NOTE ON AUTOMATION:

When you are running a large number of analyses however, it is useful to note a few things about automating outreg2.

1) Advanced formatting: Type “help outreg2” and take a closer look at the advanced features in order to be able to play with the formatting. This can save you from having to format every excel table by hand.

2) Replace: When running a number of analyses, for example the same regression over and over on individual countries, or separately for men and women… using the “replace” option on the very first analysis will make sure that you save over the old versions of your excel file when you re-run your code with the latest tweaks.

3) Append: Using the append option for your outreg2 code after each additional analysis that you wish to include in the same excel file will ensure that you have one big comparable table, which will list results for other regressions right along side the first one.

This was just a simple example to show outreg2 in action. However, one nice thing about this command is that it works well with more advanced analyses as well, including multi-level models, and can give you additional statistics such as Inter-Class Correlations… Basically, anything you can get STATA to estimate will appear in the “ereturn list” and can be outputted with outreg2.

Although it’s a bit basic, I hope you found this little geek out useful.

Please share with us some of your favorite STATA tips and tricks either in the comments, or perhaps as a guest blogger.

“Don’t Fall in Love with Yourselves”: Slavoj Žižek Speaks at Occupy Wall Street

“It’s easy to imagine the end of the world. An asteroid destroying all life and so on. But you cannot imagine the end of capitalism.” – Slavoj Žižek, Senior Researcher, Institute of Sociology, University of Ljubljana; President, Society for Theoretical Psychoanalysis, Ljubljana, Slovenia

Full transcript: http://www.imposemagazine.com/bytes/slavoj-zizek-at-occupy-wall-street-transcript

Durkheim’s Anomie in the Modern Era: A Discussion on Greece and the Occupy Wall Street Movement

This week, American Public Media’s Marketplace featured a story on the growing debt crisis in Greece. The radio interview of BBC’s Paul Mason piqued my curiosity when the discussion briefly turned to Émile Durkheim’s concept of anomie.

What are your thoughts? Share your comments below, and feel free to use the following questions as guidelines:

  • What kind of comparisons can we draw between the sentiments in Greece and the developing Occupy Wall Street movement in the United States?
  • What other theoretical frameworks could be applied to the growing disillusionment in Greece? In the U.S.?
  • What implications might the situation in Greece have for the European Union?
[Edit: The Occupy Wall Street movement has now expanded to Austin. Read about today’s protest here.]